
Filing notebook / NVIDIA / FY2025
Revenue growth is not a collection test.
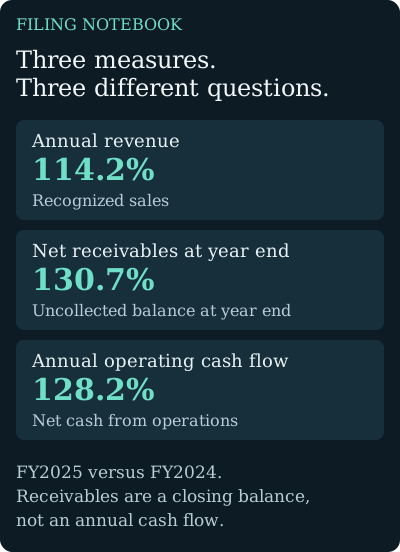
NVIDIA's FY2025 sales, receivables, and operating cash all grew sharply. Reading those changes together is useful. Treating them as three versions of the same number is not.
Open the exact SEC 10-K1. Put the right numbers beside each other
This notebook uses accession 0001045810-25-000023, filed February 26, 2025. Both annual periods contain 52 weeks. It is a fixed historical exercise, not an assessment of NVIDIA's current quarter.
Open the consolidated statements of income, balance sheets, and cash flows in the filing. Locate the three lines below. Revenue and cash flow cover a year; receivables describe a balance at the end of that year. Keep that distinction visible when comparing them.
| Reported line | FY2024 / Jan 28, 2024 | FY2025 / Jan 26, 2025 | Change |
|---|---|---|---|
| Annual revenue | 60,922 | 130,497 | +69,575 |
| Net receivables at year end | 9,999 | 23,065 | +13,066 |
| Annual operating cash flow | 28,090 | 64,089 | +35,999 |
Source: NVIDIA FY2025 10-K, consolidated financial statements. Receivables are net of the reported allowance. Operating cash is not gross customer collections.
Management's explanation: Item 7 attributes the expansion to demand for Hopper systems and describes Blackwell production shipments beginning in the fourth quarter. That explains how management frames the period. It does not, by itself, establish when each sale was collected.
2. Do not count the same customer chain twice
In Item 7, find Concentration of Revenue. Direct customers A, B, and C account for 12%, 11%, and 11% of FY2025 revenue, respectively. Adding the rounded disclosed percentages gives 34%. This describes direct customer concentration, not necessarily the ultimate users of the products.
The filing distinguishes direct purchasers, including distributors and system integrators, from indirect customers. An indirect customer can buy through more than one channel. The discussion of an indirect customer that includes direct customer B is therefore not another independent percentage to add to the direct-customer total.
There is a second comparison trap in the table: an asterisk means the customer was below the disclosure threshold, not that it bought nothing. You cannot infer that customer A grew from zero merely because its prior-year percentage is not shown.
Next, locate Note 9, Balance Sheet Components. Two direct customers account for 17% and 16% of year-end receivables. Their identities are not supplied there. Do not silently assign those balances to customers A and B from the revenue table. Concentration is relevant to collection exposure, but those two tables do not provide a customer-by-customer cash reconciliation.
3. State the narrow conclusion before the broad story
What the arithmetic establishes: year-end net receivables grew faster than annual revenue, while operating cash also grew faster than revenue. This is a reason to investigate collection timing and operating cash drivers, not evidence that one metric cancels out the other.
What it does not establish: faster receivables growth alone does not prove poor revenue quality. A growing business can finish the year with more recent, unpaid sales. Conversely, strong operating cash does not prove every sale was collected promptly. It also reflects expenses, taxes, inventory, supplier payments, and other operating movements.
A shortcut sometimes called a collection test divides ending receivables by annual revenue. That uses a single closing balance, rather than an average, against a full year's sales. It can flag a question, but it is not a complete days-sales-outstanding calculation, an aging schedule, or a measure of overdue invoices. Growth and the timing of shipments can change that ratio even when contractual payment behavior does not change.
The useful research note is therefore conditional: “Collection exposure increased in dollars. Check whether payment terms, allowances, and the timing of sales explain the closing balance.” It is more defensible than either “revenue is suspect” or “cash proves the growth is safe.” Neither investment conclusion follows from this table.
4. Work the question before revealing the answer
Receivables rose by 13,066 million. Can we subtract that from annual revenue to calculate customer receipts?
No. That shortcut omits other relevant balances and movements, including possible contract liabilities, allowances, and noncash changes. The indirect cash-flow statement reconciles net income to operating cash; it is not a customer receipts ledger. Use the revenue policy, receivables note, and cash-flow adjustments to identify what is actually disclosed, and leave an unresolved item unresolved.
Which comparison should we carry into the next report?
Use comparable durations for sales and operating cash, and record both dates for receivables. Compare a quarter's revenue with the prior-year quarter, not a full annual total. Quarterly cash-flow statements may be cumulative. Read the period label before calculating a conversion ratio.
- Record the exact accession and the definition of each measure in your research worksheet.
- Read the receivables and revenue-recognition notes for terms, allowances, and material policy changes.
- Separate a changed balance from management's explanation for it.
- Write what future evidence would weaken your interpretation, such as a larger allowance or a change in payment terms, without assuming either has occurred.
Continue with a different lens
Revenue recognition · Working-capital questions · Testing earnings against cash.
Compare the method with Meta's spending reconciliation. Current NVIDIA and AMD reference pages are separate from this historical notebook.
Use and provenance
Reported amounts and concentration disclosures come from the linked 10-K. Calculations and inference limits are Quantfil's educational analysis, not management quotations or investment advice. This is one investigation, not a valuation or an audit. Report a correction with the source line and reporting period.